What is included
✓ Mapa de gasto por categoría
✓ Concentración y dependencia de proveedores
✓ Benchmarking de condiciones
✓ Estimated savings potential
✓ Priorización por impacto y dificultad
✓ Apoyo de especialistas de compras
✓ Tracking of captured savings
✓ Conexión con X.Control
How we work
01
Understand
Context, objectives, available information and constraints.
02
Analyse
Structured assessment and quantification of opportunities.
03
Act
Roadmap, ejecución directa o coordinación de especialistas.
Example deliverable
Basic deliverable mockup
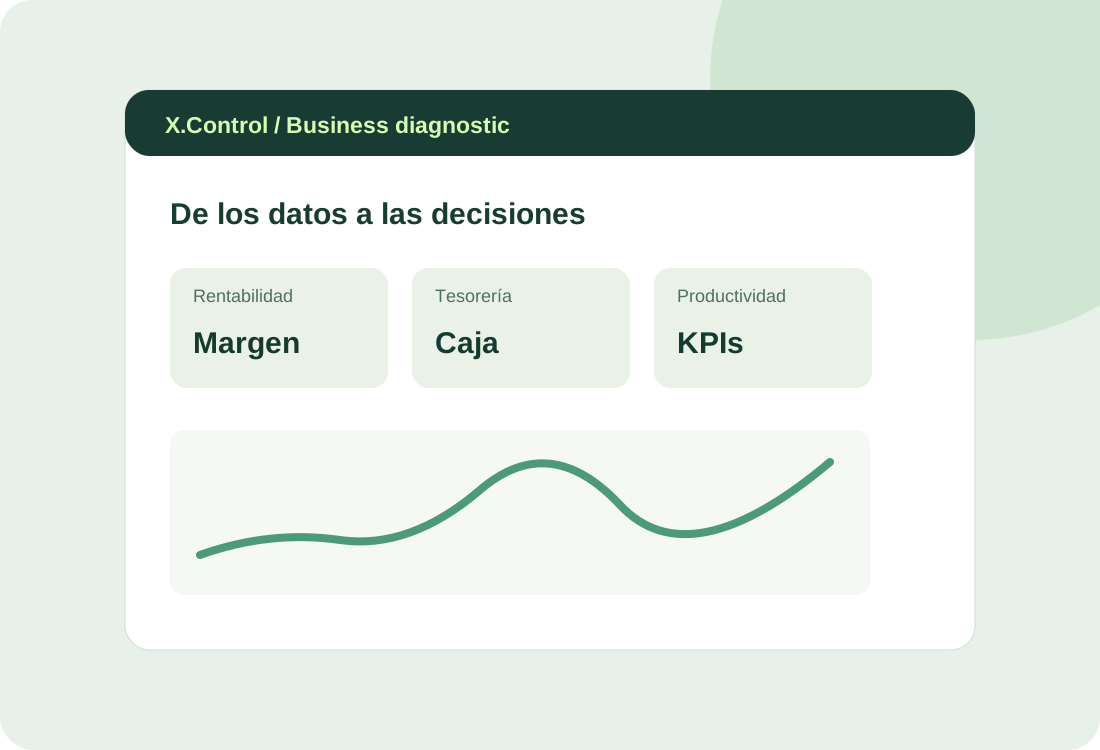
Representación visual del tipo de dashboard, mapa o entregable que recibiría el cliente.
What we aim to avoid
We do not want to produce reports that end up in a drawer. Every project should finish with clear decisions, owners, expected impact and a next step.